1. Abstract and Scope
The Strat is a price-action trading strategy built around clear candle patterns / setups, timeframe continuity, broadening formations, and actionable signals. It tries to reduce the market to what is objectively happening now rather than what a trader hopes might happen next.
The framework can be used in any market, including stocks, futures, crypto, and commodities, and across any timeframe. Whether scalping, day trading, swing trading, or position trading, the same core principles still apply. That consistency is what makes the Strat so powerful: one language, one framework, and one way to read price action across the board.
This guide is intentionally exhaustive. It covers the foundational concepts that shape trade logic, and the practical workflows used to scan, confirm, negate, size, and manage positions.
2. How to Use This Guide
Most traders learn The Strat best in layers rather than all at once. The first layer is objective candle identification. The second is timeframe continuity. The third is broadening formations. The fourth is setups and magnitude. The fifth is risk management.
Learn objective candle identification first
Until you can reliably call out 1, 2U, 2D, and 3 bars, everything else stays fuzzy.
Timeframe continuity and participation groups
Note the month, week, day, and 60-minute timeframes to determine if buyers or sellers are in control.
Practice drawing broadening formations
Learn how expanding ranges frame targets, reversals, and potential exhaustion risk.
Mark setups, including triggers and magnitude.
Ask what the setup confirms, negates, creates, or re-triggers, and what magnitude it reasonably offers.
Manage risk before anything else
Entry, invalidation, objective, and size should already be mapped before the setup goes in force.
3. Core Language: Candles and Scenarios
3.1 OHLC anatomy
Each candlestick has an open, high, low, and close. The Strat uses standard Japanese candlesticks because they preserve the information a trader needs to read structure.
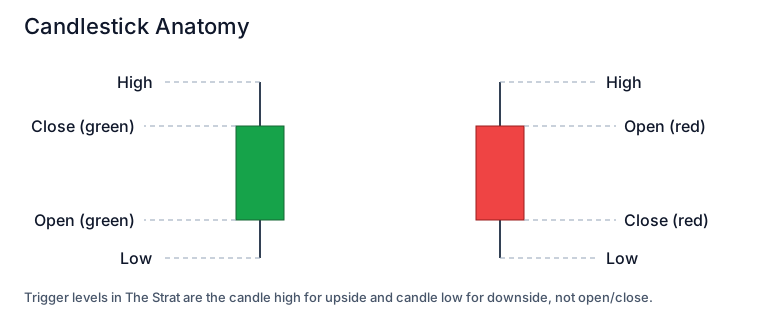
3.2 Scenario definitions
| Scenario | Rule vs Prior Candle | Interpretation | Immediate Use |
|---|---|---|---|
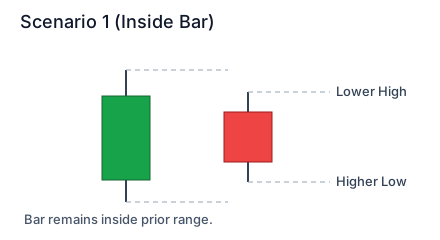
| 1 inside bar | Current high is less than or equal to the prior high and current low is greater than or equal to the prior low. | Consolidation, compression, balance, indecision. | Mark both sides and wait for the break rather than trading the middle. |
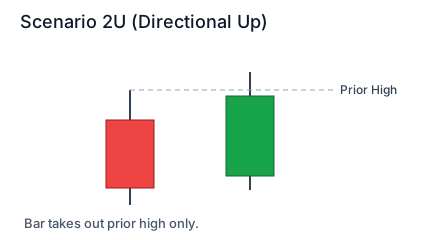
| 2U | Current high breaks the prior high without breaking the prior low. | One-sided upside expansion. | Can be a continuation or a reversal depending on context and location. |
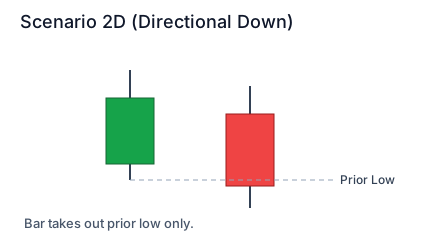
| 2D | Current low breaks the prior low without breaking the prior high. | One-sided downside expansion. | Can be a continuation or a reversal depending on context and location. |
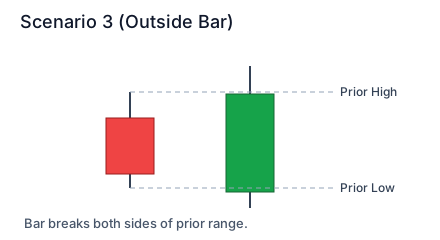
| 3 outside bar | Current candle breaks both the prior high and the prior low. | Broadening formation on a smaller timeframe. | Time actionable signals back through the previous range. Potential exhaustion. |
3.3 Candle color versus scenario
A green candle is only telling you the close sits above the open. A red candle only tells you the close sits below the open. That is different from the candle scenario, or type of candle. The framework uses both ideas, but they answer different questions. A trader who confuses them will constantly misread the setup. A 2U can be red and a 2D can be green (we call these failed 2s). The candle color does not determine the candle scenario, it only identifies timeframe continuity.
3.4 What the scenarios imply
A 1 signals compression. A 2 signals one side taking control. A 3 signals both sides already traded and volatility has expanded. This is why scenarios form the grammar of The Strat: you always know what state the market is expressing relative to the prior candle.
4. Universal Truths
4.1 Universal Truth #1: the market moves through 1s, 2s, and 3s
This is the classification engine behind the framework. Every bar is either compressing, expanding one way, or expanding both ways. Because the state vocabulary is finite, a trader can read the market in a structured way instead of drowning in dozens of overlapping pattern names.
4.2 Universal Truth #2: timeframe continuity defines control
This is the context engine. The TFC principle teaches that price must travel in the direction of the most 2s, and 2s going 3, across multiple timeframes. Put differently: the side with the most aligned participant groups usually has the best directional advantage.
4.3 Universal Truth #3: price discovery is defined by broadening formations
Broadening formations (also referred to as a "megaphone pattern") occur because of exhaustion. Eventually, they will expand. Note obvious pivots and a series of higher-highs and lower-lows to identify them.
4.4 Scenario transition matrix
| Current State | Common Next Behavior | What To Confirm | Typical Risk |
|---|---|---|---|
| 1 inside bar | Break into 2U or 2D | Which side has continuity support and enough room to matter | False break that immediately snaps back inside range |
| 2 continuation leg | Further expansion, stall, or reversal | Whether magnitude remains before exhaustion | Late chase near a completed objective |
| 3 outside expansion | Resolution continuation or reversal | Whether the move is happening at a meaningful edge | Overtrading noisy two-sided movement |
5. Actionable Signals and Setup Families
An actionable signal is the structural event that gives a trader reason to create a position. The bootcamp materials frame actionable signals as identifying the losing participants on the other side of the trade. The more clearly you can identify who is trapped and why, the better your entry timing usually becomes.
Core execution rule: long trigger = break of the setup candle high; short trigger = break of the setup candle low.
Magnitude: reversal signals need a target, and continuation signals still need room even if traders do not always label that room as formal magnitude.
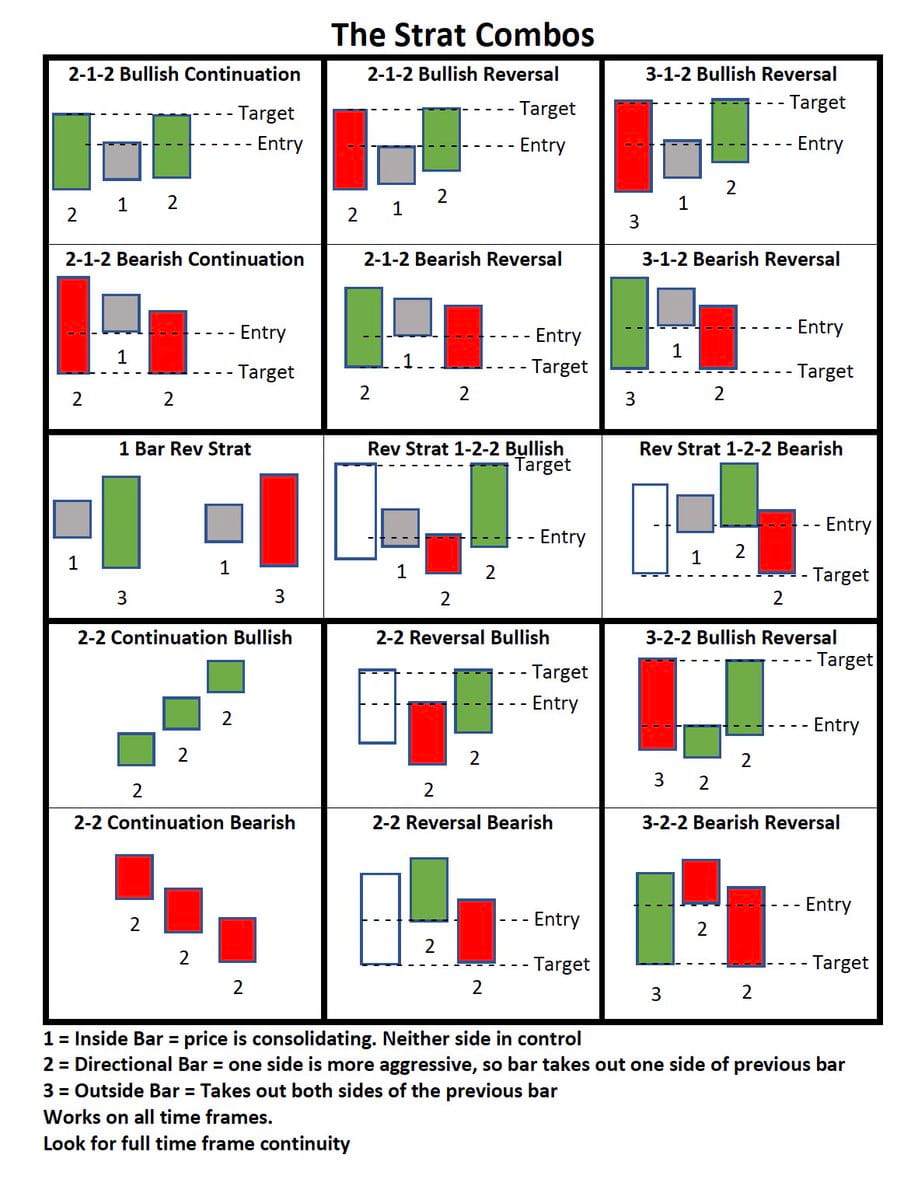
5.1 The Strat Combos
This combos sheet is a fast visual reference for the main continuation and reversal structures traders see most often. It helps connect the setup names to the actual bar sequence before the trigger.
5.2 Continuation families
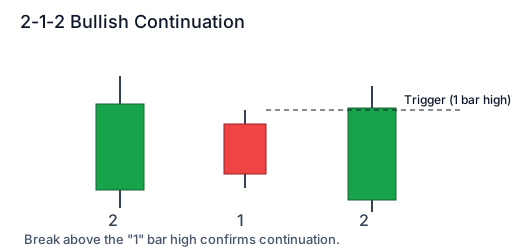
- 2-1-2 continuation: directional move, then inside pause, then same-side break.
- 2-2 continuation: one side expands and then same-side expansion continues again.
- 3-2-2 continuation: outside-bar conflict resolves and directional follow-through takes over.
- Inside-bar continuation chains: stacked compression on lower frames can feed one larger higher-frame move.
Continuation setups work best when the market still has room to the next objective and when higher timeframes are already aligned or at least not strongly opposed.
5.3 Reversal families
- 2-2 reversal: the first directional break fails and the opposite side takes control.
- 1-2-2 RevStrat: an inside bar breaks one way and then reverses the other way.
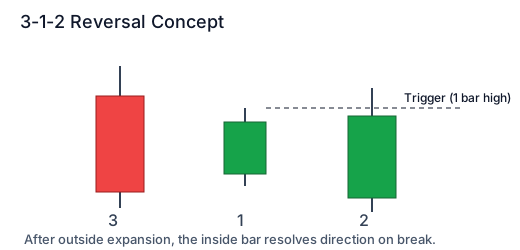
- 3-1-2 reversal: outside-bar conflict, then inside pause, then directional resolution.
- 2-1-2 reversal variants: lower-timeframe reversal structures that redirect a larger timeframe.
5.4 Outside-bar logic and 3-2-2 strength
The bootcamp materials emphasize 3-2-2 setups because the outside bar tends to be larger, so the reversal back through it can create bigger magnitudes. The training also frames 3-2-2 scanning as one of the best practical ways to find broadening formation activity.
5.5 Engulfing candles, doji bars, hammers, and shooters
These are context candles, not a separate religion. A doji often signals indecision and ongoing fighting inside a broadening formation. An engulfing or outside-style candle can highlight resolution pressure. Hammers and shooters often point to rejection, but they still need confirmation and follow-through.
- Doji bars: often imply the fight is still unresolved and the next 2 can completely change the attempted direction.
- Engulfing bars: can show aggressive takeover and are especially relevant when scenario 3 behavior matters.
- Hammer / shooter candles: best read as rejection clues plus location clues, not standalone trade reasons.
5.6 PMG and the idea of trading back through range
PMG, or pivot-machine-gun behavior, matters because price can speed up once it begins trading back through stacked prior pivots. This is especially important in gappers and in reversal situations where the market starts moving back through a previous range and forces trapped participants to react.
5.7 In-force state management
A setup is only in force after price actually trades through the trigger. Before that it is only a candidate. After the trigger, the setup can still fail if price immediately loses the level or if the continuity backdrop changes.
Example: a bullish setup goes in force above its trigger, then loses the level and falls back inside the range. The trade is telling you the original read may no longer have control.
6. Timeframe Continuity and Participation Groups
6.1 The TFC principle
The bootcamp decks call timeframe continuity the second universal truth. They describe the market as needing to trade in the direction of the most 2s, and 2s going 3, across the timeframe stack being studied. This turns continuity into a control model rather than a prediction model.
6.2 Participation groups
Each timeframe can be treated as a participant group. Because the framework cares about how those groups align, the training commonly uses at least four charts at a time.
| Participant Group | Common Frames | Decision Role |
|---|---|---|
| Macro context | Year, quarter, month | Gives the longest directional map and largest structural objectives. |
| Swing context | Week and day | Defines the tradeable directional bias most swing and swing-day traders care about. |
| Execution context | 60m, 30m, 15m, 5m | Shapes timing, smaller risk boxes, and shorter-term control shifts. |
6.3 Day + 60, override, and uncoupling
- Day + 60 reset: daily and 60-minute states can reset each session and change short-horizon control.
- Override concept: when day and 60 align strongly, they can dominate immediate flow even if higher frames still disagree.
- Uncoupling: lower and higher participant groups disagree, so the trade often needs tighter management.
6.4 Full timeframe continuity
Full timeframe continuity is the strongest version of alignment. When the bootcamp materials say a signal has FTFC, the idea is that the short and long participant groups are stacked in the same direction, leaving very little structural reason for the trade to fail at that moment.
6.5 Practical continuity scorecard
| Score | Description | Execution Guidance |
|---|---|---|
| 4/4 aligned | Chosen participant groups all support the same side. | Normal size and cleaner continuation logic. |
| 3/4 aligned | Strong alignment with one friction point. | Still valid, but know exactly which frame may slow the move. |
| 2/4 split | Balanced conflict. | Reduce size and prefer edge-location trades. |
| 1/4 aligned | Counter to dominant flow. | Treat as a high-selectivity exhaustion setup only. |
7. Broadening Formations and Tightening Ranges
7.1 Broadening formation definition
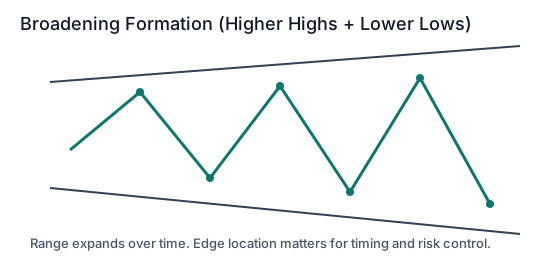
A broadening formation is a structural regime where price alternates through higher highs and lower lows over time. It is where directional certainty often gets trapped and where reversal setups become more meaningful because price has already explored both sides of the range.
7.2 The edge principle
The edge principle is simple but powerful: directional opportunities are often better near the edges of a broadening structure than in the middle. Price at the edge already told you something about location. Price in the middle often tells you much less.
- At the upper edge, bearish reversals become more interesting if upside objectives are already complete.
- At the lower edge, bullish reversals become more interesting if downside objectives are already complete.
- Middle-range trades are usually lower-quality unless another strong factor improves asymmetry.
7.3 TTO: corrective versus exhaustion activity
TTO helps separate a temporary pause from a real exhaustion turn. The practical question is: has the prior move already done enough to justify expecting reversal behavior, or is the market just cooling off before continuing?
- Before the objective: counter movement is more often corrective.
- After the objective: the odds of true exhaustion reversal increase.
7.4 Tightening ranges and mother-bar problems
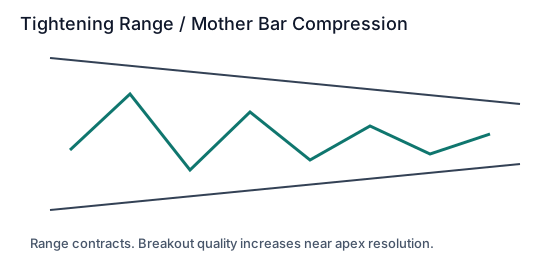
Tightening ranges represent the opposite environment: compression, shrinking range, and often weak asymmetry in the middle. New traders often donate money by forcing trades here before a break actually occurs.
8. Magnitude, Targets, and Exhaustion
8.1 Magnitude
Magnitude is the usable space between your trigger and the next meaningful objective. The actionable-window materials even visualize this as a box between trigger and target. If the box is too small, the trade may not be worth taking even if the setup looks valid.
8.2 Objective hierarchy
- The nearest opposing-side pivot from the active setup.
- The next structural pivot if the first target clears with continuation.
- A higher-timeframe target when a lower timeframe is being used to domino into it.
8.3 Exhaustion types
- Price exhaustion: price already reached the obvious objective or broadening edge.
- Time exhaustion: the signal triggers too late in the session or candle life to move cleanly.
- Context exhaustion: continuity or structure stops supporting the original thesis.
One of the cleanest Strat habits is reassessing after target completion rather than assuming the same directional edge is still alive just because price kept moving that way earlier.
9. Universes, Confirmation, and Scanning
9.1 What a universe is
The bootcamp defines a universe as your trade plan. The point is not to trade every idea in the market. The point is to choose one workflow that fits your current skill level and execute it repeatedly enough to learn what right looks like.
9.2 Starter universe: gappers
The training explicitly recommends the gapper universe as a starting point for many newer traders. The reason is that volatile gapping stocks can move hard when they work and can still be traded with tight intraday stops when they do not.
- Focus on 30-minute and 60-minute reversals in volatile gapping names.
- Earnings gaps are especially useful because the catalyst is known and scheduled.
- Trading back through a previous range is powerful because PMG behavior can accelerate the move.
- Patience matters. The materials explicitly warn against rushing the open and overtrading midday noise.
9.3 Simultaneous breaks
A simultaneous break happens when multiple correlated assets break a 2 in the same direction at the same time. The training treats this as one of the most definitive signals in the playbook because it points to broad participation and algorithmic activity.
- Look for simultaneous breaks across indices or across names within a sector.
- Pre-break analysis matters: concentration of actionable signals can identify the potential break before it fires.
- Post-break analysis helps determine whether the move has true follow-through or was just a quick liquidity event.
9.4 Confirming and negating
The confirming-and-negating workflow studies how one move either confirms prior direction or negates it on the next candle. The bootcamp anchors this to the major indices and sector ETFs: SPY, QQQ, IWM, DIA, and the sector universe. This becomes a way to identify relative strength, relative weakness, and trapped participants.
- A continuation confirms the prior move.
- A reversal negates the prior move and can trap the previous day’s participants.
- The same logic can be used to locate the weakest or strongest name relative to the index or sector benchmark.
9.5 Create, negate, or do
One of the best mental models in the bootcamp is asking what a signal will create, negate, or do. If it works, what higher-timeframe event does it create or confirm? If it fails, what continuity does it negate? If it simply follows through, what does that say about control staying the same?
This question forces the trader to think one step ahead instead of reacting only to the current candle.
9.6 Sector and index universes
A sector or index universe narrows your focus to names that can be compared against a common benchmark. The idea is to use the benchmark to judge relative strength and weakness, then select individual names with better structural evidence than the benchmark itself.
- DIA is often a friendlier index universe for newer traders because it covers fewer names.
- Sector ETFs help confirm or negate the direction of their holdings.
- Trying to watch every universe at once usually creates decision overload.
9.7 Night, week, month, quarter, and year universes
The higher-timeframe universe materials treat daily, weekly, monthly, quarterly, and yearly signals as separate but related universes. A daily signal can re-confirm something already known on the quarterly chart, and a shorter-term trader can still participate in that bigger idea using shorter entries and shorter management.
9.8 Strat Attack
The Strat Attack universe focuses on daily 2-2 continuations early in the week when a higher timeframe signal is already in force. The logic is straightforward: if a buyer shows up on Monday and buys again on Tuesday with higher-timeframe support behind the move, there may still be more order flow in the same direction.
10. Actionable Windows and Domino Trades
10.1 The actionable window
The actionable window, sometimes called the take-action window, is a visual representation of magnitude. It is the box between trigger and target. If price is inside that window with the setup in force and the target still open, the trade has a reason to be on.
10.2 Lower-timeframe confirmation
Newer traders are encouraged to avoid blindly smashing the open and instead wait for lower-timeframe signals that re-confirm the higher-timeframe idea inside the actionable window. This improves the evidence stack and often improves the risk box too.
10.3 Lower-timeframe re-triggering
A lower timeframe can also re-trigger a higher-timeframe signal after the first break. This matters because traders do not have to be the first person in. If the higher-timeframe thesis still has magnitude, a later lower-timeframe setup can still be an excellent entry.
10.4 Domino logic
- Choose the anchor higher timeframe and identify its trigger and target.
- Drop to a lower timeframe and find a setup in the same intended direction.
- Confirm the lower setup is happening inside the higher-timeframe actionable window.
- Enter with the lower risk box while still trading toward the higher objective.
- Manage the trade based on whether the higher-timeframe signal remains valid.
11. Market Mechanics and Instrument Choice
11.1 Start with evidence
The introductory materials frame the trader as a data scientist. The idea is to only come to conclusions backed by what is known to be true right now. That mindset is a major part of what makes The Strat useful: it tries to keep you evidence-first.
11.2 Bid, ask, and spread
- Buying at the ask and selling at the bid represent aggressive participation.
- Spread matters because tight stops on thin names can get clipped by poor liquidity alone.
- Liquidity quality should influence both instrument selection and size.
11.3 Instrument-specific notes
- Stocks: clean for learning the structure and the gapper workflow.
- Options: direction alone is not enough; time and volatility matter too.
- Index and sector ETFs: excellent for confirmation, negation, and relative-strength work.
11.4 Charting hygiene
- Use consistent session settings so your candles do not change from one review session to the next.
- Prefer clean candlestick charts while learning the framework.
- Keep trigger, stop, and objective levels visible across timeframe transitions.
12. Worked Examples
Worked example visuals and annotated walkthroughs will live here. This section is being held open for the screenshot set you want to add next.
13. Risk, Stops, and Position Sizing
13.1 Stop logic
The stop should represent thesis invalidation, not random emotional comfort. The bootcamp materials emphasize that stops can be much tighter than what many traders are used to because the framework assumes a good setup should often work quickly if the evidence is real.
13.2 Three stop placements
- Tightest: spread plus a small amount, used to teach discipline and prevent large losses.
- Tight: the open of the candle you enter on or another nearby structural defense line.
- Wide: a larger reversal against your entry timeframe when the evidence stack justifies more breathing room.
13.3 Evidence-based stop width
The materials describe stop choice like a temperature gauge: the more evidence you have, the more room you may be willing to give the trade. Evidence includes the number of signals in force and the amount of continuity support behind the trade.
13.4 New-trader suggestion
The bootcamp explicitly recommends that new traders use shares and small size, with very tight stops, to build discipline. The goal is to get comfortable exiting bad trades quickly instead of turning every mistake into a large account drawdown.
13.5 Position sizing formula
Normalize results in R multiples so you can compare trades honestly across symbols and timeframes.
13.6 Management rules
- Move to break-even because the structure earned it, not because fear made you impatient.
- Scale or trail based on objective logic and continuity, not on excitement.
- If the trade loses the level that defined control, reassess immediately.
- Do not let a planned trade mutate into an unlimited opinion.
14. Comprehensive Checklist
- Classify the bar correctly as 1, 2U, 2D, or 3.
- Map the participant groups you care about and decide who controls them.
- Identify location: broadening edge, previous range, tightening range middle, or open trend space.
- Define the trigger using the setup candle high or low only.
- Ask what the signal will create, negate, or do if it works or fails.
- Define invalidation and choose the stop structure that matches the evidence stack.
- Map the objective and confirm the trade still has enough magnitude.
- Size from risk budget, not from conviction.
- Track whether the setup remains in force after entry.
- Review whether the result matched the plan, not just whether the P&L was green.
15. 30-Day Learning Plan
Week 1: language and classification
- Label at least 200 historical bars as 1, 2U, 2D, or 3.
- Practice saying what the next actionable break would be before you look ahead.
Week 2: setups and triggers
- Collect examples of 2-1-2, 2-2, 3-1-2, 3-2-2, and 1-2-2 RevStrat patterns.
- Write trigger, stop, and objective for every example.
Week 3: context and structure
- Mark broadening formations, tightening ranges, and PMG paths on at least 30 charts.
- Compare trades taken at edges with trades taken in the middle.
Week 4: universes and review
- Pick one universe to focus on: gappers, simultaneous breaks, or a sector/index workflow.
- Replay the week and grade whether your signals were confirmed, negated, or never really in force.
16. Failure Modes and Fixes
| Failure | Why It Breaks | Correction |
|---|---|---|
| Trading pattern names without context | The setup shape is there, but the evidence stack is weak. | Require scenario, continuity, location, magnitude, and invalidation together. |
| Using the wrong trigger level | Open and close get substituted for actual structural boundaries. | Use setup candle highs and lows only. |
| Forcing trades in the middle of compression | Tightening-range middles have poor asymmetry. | Wait for a real break or an edge test. |
| Ignoring magnitude | The trade can be right on direction and still poor on payoff. | Skip or reduce size when the actionable window is too small. |
| Watching too many universes at once | Decision overload replaces process quality. | Shrink to one or two universes until your process is repeatable. |
| Oversizing because the setup feels certain | Variance punishes conviction without risk control. | Use fixed-risk sizing and review in R multiples. |
Use the guide as a manual, not just a one-time read
The real edge comes from repetition: classifying bars correctly, respecting continuity, choosing a universe you can actually manage, and reviewing your decisions with enough honesty to improve. This page should support that process.